Get More Insight in Less Time ™

Quick Results
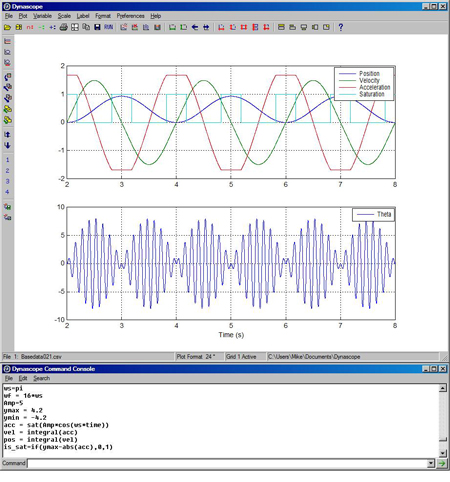
Explore your data more effectively when you can create or change a plot with just a couple mouse clicks. Most commonly used plotting functions can be conveniently accessed through toolbar buttons.

Simple Operation
Get up to speed quickly with Dynascope's simple, intuitive user interface. It lets you focus on your results, not on the mechanics of creating your plots.
User Support
Get answers to your questions, and help with any usage problems, through our email technical support service. We'll do our best to respond within one business day.
Program Overview
Dynascope was designed to be an efficient environment for evaluation of time response data that allows plotting and analysis to be done quickly with a minimum of effort. Dynascope enables users to quickly and easily create time response plots and parametric plots of time response data. Plot variables can be read directly from CSV formatted files and other text files, or can be calculated by entering the equations that define them. A single calculation can be made to operate on multiple data files at the same time. Data from multiple files can be read into memory, plotted, and used for calculations without the need for any programming beyond defining the equations to be used. Dynascope allows users to work with up to 98 data files at a time.
Mathematical calculations are supported by a substantial and growing library of math functions which supports general equation solving and includes packages for digital filtering, frequency analysis, and statistical analysis. Users can also create bar graphs, frequency response plots, and several types of plots often used in statistical analysis such as histograms, box plots, scatter plots, and normal probability plots.
Once a plot has been created, its format can be stored and reused with data from other files in the same plotting session, or at a later time. Nearly every program function can be accessed through both program menus and typed commands. Commands and math expressions can be entered either on the command line or from command files. Data calculated in a Dynascope session can be saved to a CSV file. This allows the results of those calculations to be retrieved for use in further sessions or transferred to other programs.
Dynascope is intended to provide convenience and ease of use that enables users to examine their data more efficiently and achieve greater insight.