Features

What advantages does Dynascope ® provide?

  • Quick & Easy Plotting

Plot your data with just a few mouse clicks. Read, plot, and calculate data from multiple data files without programming beyond defining the equations you use. Save plot formats with the click of a button to make them available for reuse in future sessions. Store commonly used equations and commands in command files.

  • Custom Calculations

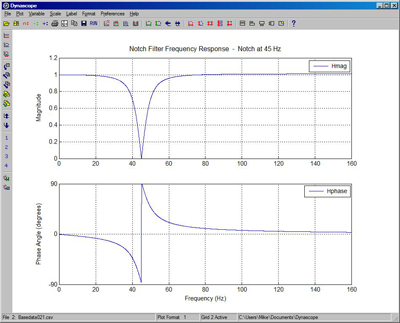
Use post processing to achieve greater insight. Just type in equations to evaluate your results or to create new variables for plotting. Use our library of math functions for digital filtering, frequency analysis, statistical analysis, and many other mathematical operations.

  • Multiple File Processing

Read in dozens of data files with just a few mouse clicks. Work with up to 98 files at a time. Cycle a plot through multiple files with the click of a button. Apply your equations to one data file, or all data files, without having to program.

  • A Cost Effective Solution

Benefit from quick and easy plotting, convenient post processing, and easy handling of multiple data files at a cost that delivers high value.

  • Dynascope ® key features at a glance

  • Plot time series data from CSV files and many other text files.
  • Contact us about support for other data file formats.
  • Data files can be read by just clicking on filenames, or on a range of filenames, with program memory assigned automatically for each file.
  • Time response plots, parametric plots, and many other types of plots can be created by just selecting the desired variable names.
  • A single plot can display up to 36 variables, with as many as 8 grids, and use up to 8 axes per grid.
  • Plot formats, that is everything about a plot except the data itself, can be saved for reuse.
  • With a single mouse click, you can store or update a plot format, or create a new plot with an existing format.
  • You can store and work with up to 80 plot formats at a time.
  • Display values of plotted data at a time point selected with your mouse.
  • The data being plotted can also be viewed as a table of numerical values.
  • You can calculate additional plot variables and evaluate performance metrics using your equations with our library of supported math functions.
  • Condition signals using low pass, high pass, band pass, and notch filters – implemented as either normal causal or zero-phase filters.
  • Compute and plot an FFT amplitude spectrum or PSD of a signal with as few as three mouse clicks.
  • Compute and display a statistical summary of a data sample with three mouse clicks.
  • Compute and plot a histogram, box plot, or normal probability plot of a data sample with three mouse clicks.
  • Equations can be applied to the data of a specific file, or to every data file, without special programming.
  • Command files can be used to store and run sequences of equations and program commands.

Get Started with a FREE trial

60 day free trial | No credit card required

Free Trial